Our Results
School Performance Tables
View the Department of Education Schools Performance Tables
View Beaconsfield High School's School Performance Table
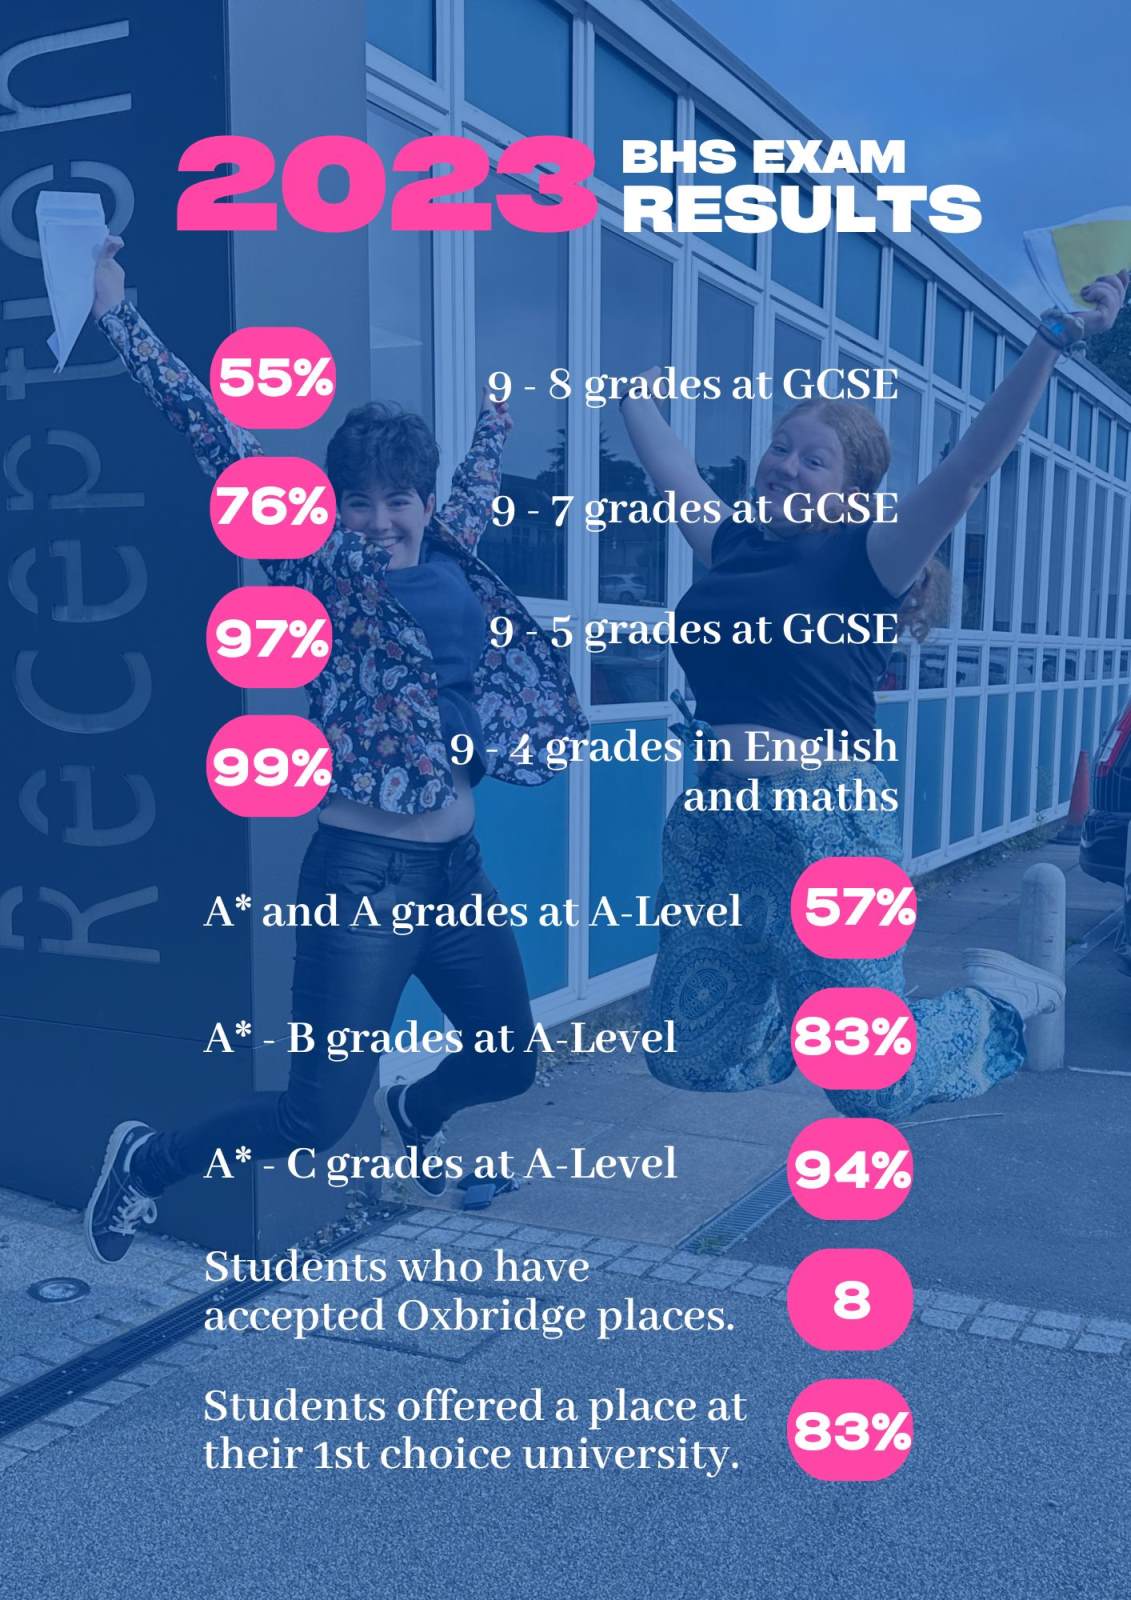
Exam Results 2023
2023 Key Stage 4 Results Summary
|
Pupils achieving Grade 5 or above in English and Maths GCSEs |
98.9% |
|
Pupils entering for the English Baccalaureate |
70.9% |
| Pupils achieving the English Baccalaureate at grade 5/C or above | 55.8% |
| Progress 8 score (progress made during secondary) | +1.03 |
| Attainment 8 score (results in core subjects) | 76.6% |
| Pupil destinations - pupils staying in education or going into employment | 100% |
2023 Key Stage 5 Results Summary
|
The progress students have made in English and Maths |
NE |
| The progress students have made compared with students across England | n/a |
| The average grade that students get at 16 to 19 study (key stage 5) | B+ |
|
% of students completing their main study programme |
100% |
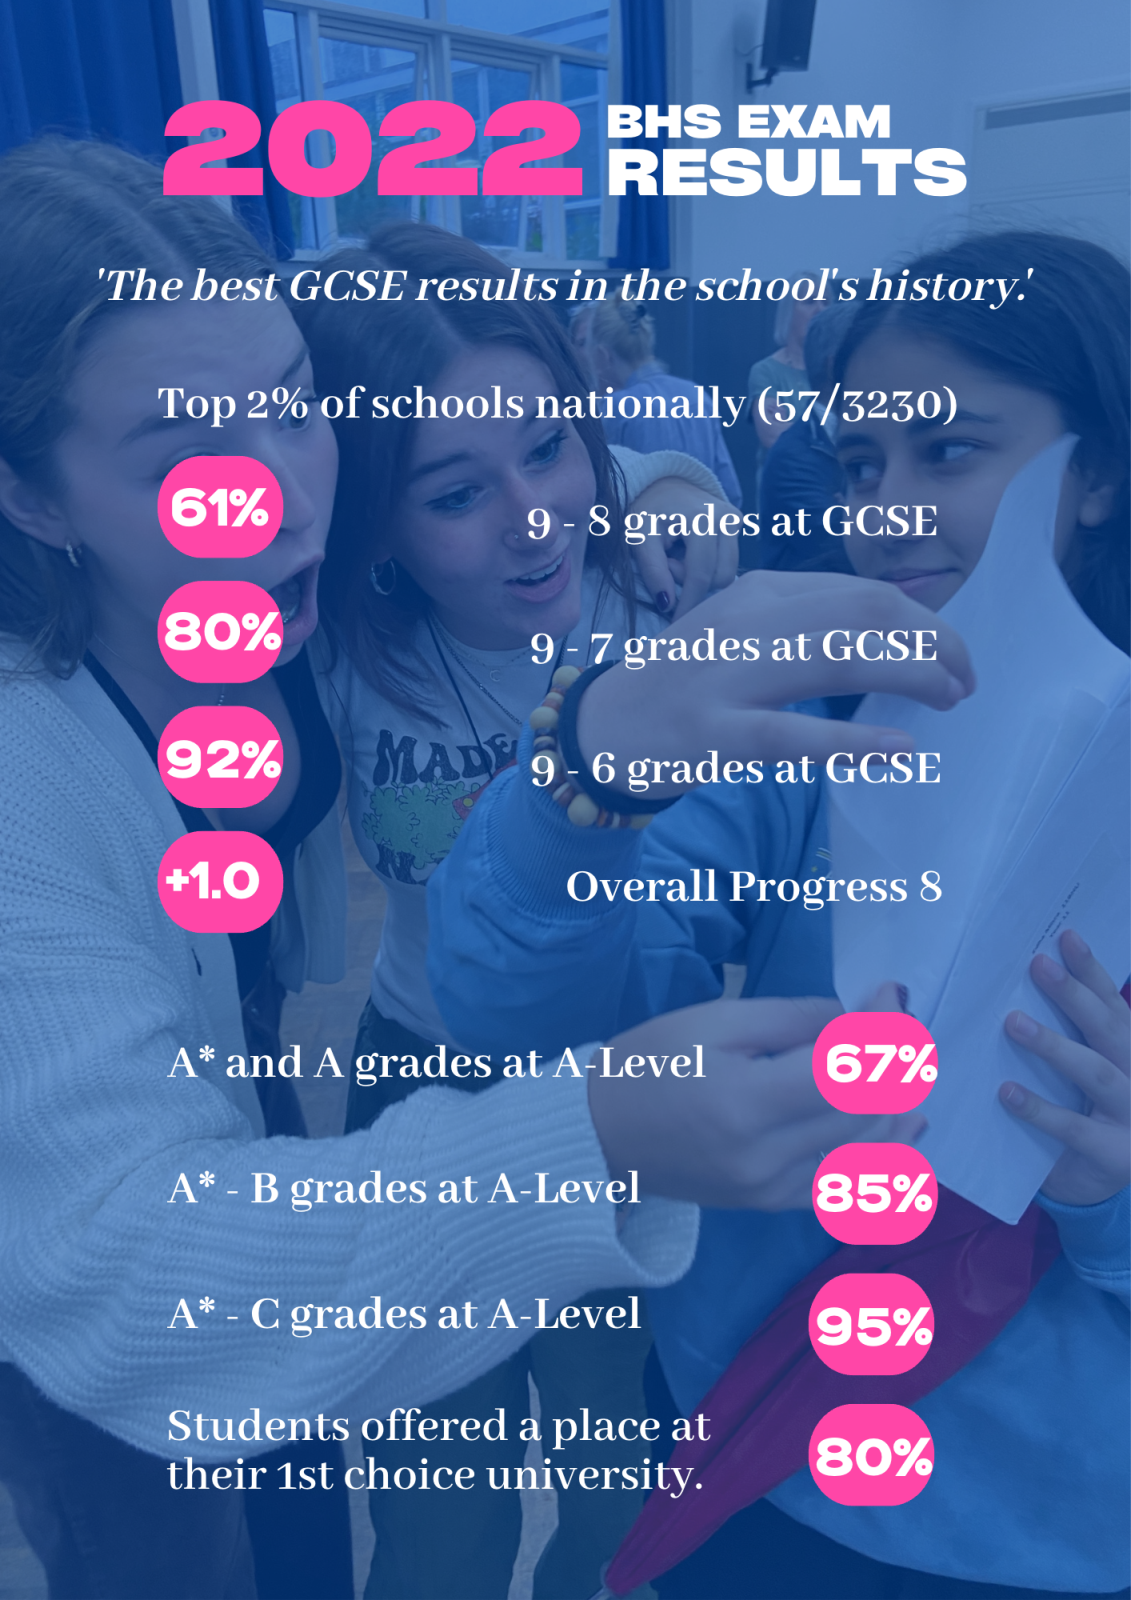
Exam Results 2022
2022 Key Stage 4 Results Summary
|
Pupils achieving Grade 5 or above in English and Maths GCSEs |
100% |
|
Pupils entering for the English Baccalaureate |
70.9% |
| Pupils achieving the English Baccalaureate at grade 5/C or above | 66% |
| Progress 8 score (progress made during secondary) | 0.97 |
| Attainment 8 score (results in core subjects) | 79.8 |
| Pupil destinations - pupils staying in education or going into employment | 98% |
2022 Key Stage 5 Results Summary
|
The progress students have made in English and Maths |
NE |
| The progress students have made compared with students across England | n/a |
| The average grade that students get at 16 to 19 study (key stage 5) | B+ |
|
% of students completing their main study programme |
100% |
2021 Qualifications
Teacher Assessed Grades – August 2021
A note from Rachel Smith, Headteacher of Beaconsfield High School (April 2015 - November 2022)
Many Headteachers and Principals in secondary schools within Buckinghamshire have chosen to make similar comments with regards to the examination outcomes this TAG year.
The usual statistical analysis of each cohort is not appropriate and the different model of assessment this year means that year-on-year comparisons are unhelpful. We have therefore adopted a different approach. I want to pay tribute to the students, parents, families, and staff in our school, other schools, and local colleges for their remarkable attitude to the numerous challenges faced in the last 18 months.
As a counter to the media concerns of ‘grade inflation', I want to take this opportunity to celebrate what has been achieved by us and all of our secondary educational community. The qualifications awarded to our students, mainly but not exclusively in Years 11 and 13, are recognition of their commitment and hard work. This year, their resilience and flexibility has also been tested, as they have had to adapt to the many challenges posed by the COVID pandemic.
These outcomes are set against the national (and global) context that has affected so many of our lives but also an assessment system that repeatedly changed, often at very short notice. We are delighted that our students have risen to these challenges and secured an excellent set of results that most importantly allows them to access the next stages of their education or training. The absence of a formal examination period has meant they have had to focus and apply themselves for an extended period of time to gain these outcomes. The character that our students have shown, through resilience and adaptability, not only deserves recognition but also will ensure that they thrive at these next stages of their lives. Education has always been about both knowledge and skills and perhaps even more so during this pandemic.
This process has been largely delivered by our staff and, of course, other staff in our secondary education community. This has been done with integrity, care, and compassion. Staff care deeply about students and their progression and have balanced this with the need to be fair to students at other establishments. The confines of the system we were given to operate in may have proved challenging at times, but we have done our best to be both advocates for our present students, whilst supporting past and future students’ aspirations.
The final part of this jigsaw is the parents and families whose role in supporting their children through these past 18 months cannot be underestimated. This pandemic has placed challenges on all households and the changing nature has added uncertainty into the mix. For those households with students of examination age, this has been magnified and as Headteacher of Beaconsfield High, I am joining with other leaders in our communities to thank you for your support. You should be proud of what your children have achieved and your role in helping them get to this position.
Together we have navigated our way through the changing landscape but this has happened not by chance, but by holding true to our values, the support of our whole community, and the sheer hard work of our students.
Thank you, well done, and we wish your children all the best for the next chapter in their life.
2020 Qualifications
In 2020 qualifications were awarded through the provision of a centre assessed grade because of the cancellation of public examinations. As such, those results are not comparable with previous years' outcomes and are not published here.
Exam Results 2019
2019 Key Stage 4 Results Summary
|
Pupils achieving Grade 5 or above in English and Maths GCSEs |
98.3% |
|
Pupils entering for the English Baccalaureate |
87.0% |
| Pupils achieving the English Baccalaureate at grade 5/C or above | 76.7% |
| Progress 8 score (progress made during secondary) | 0.81 |
| Attainment 8 score (results in core subjects) | 75.1 |
| Pupil destinations - pupils staying in education or going into employment | 96% |
2019 Key Stage 5 Results Summary
|
The progress students have made in English and Maths |
NE |
| The progress students have made compared with students across England | 0.01 |
| The average grade that students get at 16 to 19 study (key stage 5) | B+ |
|
% of students completing their main study programme |
97.8% |
Exam Results 2018
2018 Key Stage 4 Results Summary
|
Pupils achieving Grade 5 or above in English and Maths GCSEs |
97.3% |
|
Pupils entering for the English Baccalaureate |
94.6% |
| Pupils achieving the English Baccalaureate at grade 5/C or above | 79% |
| Progress 8 score (progress made during secondary) | +1.21 |
| Attainment 8 score (results in core subjects) | 75.8 |
| Pupil destinations - pupils staying in education or going into employment | 100% |
2018 Key Stage 5 Results Summary
|
the progress students have made in English and Maths |
NE |
| the progress students have made compared with students across England | +0.12 |
| the average grade that students get at 16 to 19 study (key stage 5) | B+ |
|
% of students completing their main study programme |
98.4% |
Exam Results 2017
2017 Key Stage 4 Results Summary
|
Pupils achieving Grade 5 or above in English and Maths GCSEs |
93% |
|
Pupils entering for the English Baccalaureate |
86% |
| Pupils achieving the English Baccalaureate at grade 5/C or above | 72% |
| Progress 8 score (progress made during secondary) | +0.76 |
| Attainment 8 score (results in core subjects) | 72.1 |
| Pupil destinations - pupils staying in education or going into employment | 100% |
2017 Key Stage 5 Results Summary
|
the progress students have made in English and Maths |
NE |
| the progress students have made compared with students across England | +0.15 |
| the average grade that students get at 16 to 19 study (key stage 5) | B+ |
|
% of students completing their main study programme |
98.6% |
Key Stage 5 School Performance Table
Exam Results 2016
2016 Key Stage 4 Results Summary
| Pupils achieving 5+ A* to C GCSEs (or equivalent) including Maths and English | 100% |
|
Pupils achieving Grade C or better in English and Maths GCSEs |
100% |
|
Pupils entering for the English Baccalaureate |
79% |
| Pupils achieving the English Baccalaureate | 74% |
| Pupils making expected progress in Maths | 97% |
| Pupils making expected progress in English | 99% |
| Progress 8 score (progress made during secondary) | +0.56 |
| Attainment 8 score (results in core subjects) | 71.3 |
| Pupil destinations - pupils staying in education or going into employment | 98% |
2016 Key Stage 5 Results Summary
|
The progress students have made in English and Maths |
NE |
| The progress students have made compared with students across England | -0.14 |
| The average grade that students get at 16 to 19 study (key stage 5) | B |
| Student retention (the percentage of students who get to the end of their study programme) | 99% |
| Student destinations (the percentage of students who continue in education or training, or move on to employment at the end of 16 to 19 study | 96% |
For more data please visit the Department of Education Schools Perfomance Tables